Nowadays, a lot of right-wing politicians are inclined to point out that the green economy is a costly venture and only in rare cases can it be lucrative for the business. The most prominent proponent of this position is no doubt the US President Donald Trump, a former co-holder of fossil oil concessionary rights in Siberia and a permanent favourite of the petrol magnates of Texas, who had been supporting his second presidential campaign long before the US tech magnates and banks re-switched on the same wave in the post-election situation. Donald was also so sincerely interested in the well-being of Europe that at the beginning of one of his two recent visits to it publicly advised the Scandinavian governments not to ruin their beautiful countries with the foolish choice of green economic models despite of the facts that these countries are world leaders exactly in the development of green economic models and Norway prefers to export its own natural gas instead of increasing its domestic use. But Donald knows that America must always be first, and we can understand him easily about what he has on his mind when he gasps for these and other similar invocations here and there.
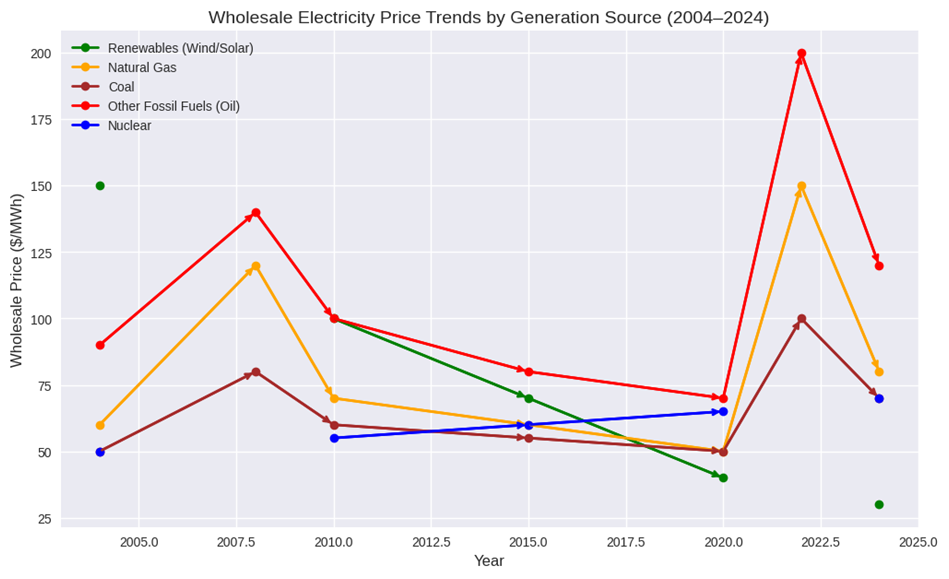
Let us start our analysis of the green energy sourcing and the truths and lies about the energy prices from the chart below, which shows that Donald should have been too excited under his drive towards America First while sharing his existential wisdom in the beautiful Europe:
Source: Copilot AI web data aggregating
The chart makes clear that in the last 20 years, the electricity generated by renewables (wind/solar) has gone from the most expensive energy source to the cheapest one. With no interim fluctuations. Close to it still is nuclear energy, and the most costly has always been, after 2006, the electricity produced by oil, followed by natural gas. This data aggregation is done on a world economy basis, not as per the Scandinavian economies. Besides, the compared wholesale prices do not include accrued taxes from government regulations. So, Donald may be a patriot, lobbyist or racketeer, but he is certainly not honest about the sourcing cost of the green economy. Amazingly, it goes with the fact that he is a good conservative Christian who should inevitably be familiar with all Ten Commandments.
· Iceland’s geothermal energy is another example of a low-cost, domestic renewable supply.
Innovation & Technology Leadership
· Scandinavian countries invest heavily in green innovation, R&D, and clean tech industries, which creates high-value exports (wind turbines, battery technologies, smart grids).
· This offsets domestic energy costs by positioning them as global leaders in green technology markets.
· Revenues from green taxes are often recycled into innovation subsidies, infrastructure, and social welfare, reducing the burden on businesses.
Energy Efficiency & Productivity
· Nordic industries are highly energy-efficient, meaning that even if electricity prices are higher, output per unit of energy is greater. In 2024, the United States generated about 10,400–10,600 USD per tonne of oil equivalent (TOE), while the Nordic (Scandinavian) countries averaged closer to 14,000–15,000 USD per TOE.
· This efficiency keeps production costs competitive compared to economies that rely on cheaper but less efficient fossil fuels.
Export Competitiveness in Green Branding
· Scandinavian companies benefit from a “green premium” in global markets. Products branded as sustainable (from furniture to food) often command higher prices internationally.
What makes the Scandinavian wind turbines, battery technologies and smart grids competitive vs. the Chinese ones?
Scandinavian clean-tech industries compete with Chinese ones not by being cheaper, but by being more reliable, bankable, innovative, and integrated into advanced energy systems. Their strength lies in quality, trust, and system-level expertise, while China dominates in scale and cost.
Key Competitive Advantages of Scandinavian Clean Technologies
Now, can you feel well where the spring of Donald’s sensitivity to the Scandinavian green economies looms up from? If not, let me help you. While America’s best exports are dollars worldwide, the Scandinavians export industrial output and if America can seldom compete industrially with China, Nordic firms like Vestas (Denmark) and Northvolt (Sweden) export wind turbines and batteries worldwide. Further, while the industry makes only 10% of the US GDP, it generates 23-24% of the Danish GDP, 21-22% of the Swedish GDP, 37-39% of the Norwegian GDP, and 20-23% of the Finnish GDP. This time, you probably notice that the Scandinavian level of industrialisation is quite similar to the Chinese one (25%). It also explains why the Scandinavian inflationary rates are closer to the Chinese ones and not to the American ones, although the Nordic countries have highly developed service sectors in contrast to China. Donald as a good patriot and a nominee for a Peace Nobel award cannot do much to change this reality, neither by bombarding Venezuelan ships for supposed drugs trafficking in international waters nor by threatening to destroy the Muslim terrorists in Nigeria that are killing innocent Christians there, because if in both cases his actions promote high fossil fuels prices globally, it delivers a weak echo to the Northern Europe’s economies. Like the war of Putin in Ukraine and, unlikely the US tariffs. Of course, here, it is just a small detail that Mr Putin has never been nominated for the Nobel Peace Prize but is only searched by the ICC for crimes against Ukrainian children, rather disgracefully in fact, after Mr Putin is also a good Christian like Donald. Why then do the titanic efforts of Mr Trump to keep high global carbon prices fail to significantly affect the Scandinavian countries? On the one hand, their energy mixes have low prices due to the essential stake of the renewables in them:
Country Avg. Wholesale price (est. 2025) Notes on energy mix
Norway ~€30–40/MW Dominated by hydropower
(~90%), very low-cost
generation
Sweden ~€35–45/MWh Hydro (~38%), nuclear (~30%),
wind (~25%), stable low-
carbon mix
Denmark ~€80–100/MWh Wind (~55%), solar (~10%),
biomass (~18%), but reliant on
imports and fossil backup,
raising prices
Finland ~€50–60/MWh Nuclear (~35%), hydro (~20%), imports from Nordics, higher
On the other hand, they are around the energy prices in America (~$40/MWh, est. 2025) in Norway and Sweden and much lower than in China - ~$90/MWh as of 2024 data (excl. Denmark). If we continue to analyse economic data, we shall see that the Scandinavian economies demonstrate better efficiency than the US economy, although Donald believes that their societies are destroying their nice countries with green fantasies. For example, Denmark, with its costly energy mix (but no more costly than the average EU cost of ~€90/MWh) achieved almost 15 times higher industrial returns than the US industry provided in the last decade (2014-2024):
Country Avg. Industrial Growth Key Drivers 2024 Snapshot
USA ~0.3% per year Software, pharma, Service heavy
finance
Norway ~0–1% per year Oil&gas, energy Volatile, near exports stagnation
Sweden ~1.5% per year Automotive, machinery, Industrial goods pharma, and ICT dominate exports
Denmark ~4.1% per year Pharma, renewables, +7.8% growth high-tech
Finland ~1–2% per year Forestry, electronics, Industry = 22.1% manufacturing of GDP
Sources: National statistical entities
The industrial superiority of the Nordic countries against America can be clearly seen in the structure of the industrial retail sales on the domestic markets (it is also linked with energy efficiency). In 2024, Scandinavia had some of the world’s highest EV shares of new passenger car sales:
· Norway: ~92%
· Sweden: ~58%
· Denmark: ~56%
· Finland: ~50%
By contrast, the United States had only about 10% EV share of new light-duty vehicle sales.
Further, considering the efficiency, we should note that the Scandinavian superiority over the U.S. is not limited only to the industrial sector. It is valid for the big picture of the entire socio-economic spectrum, being sealed under a higher quality of life.
Why is it so? Most of all, because the Scandinavian countries can afford a standard of living not infinitely different from the US one, but keeping lower investment efficiency in their overall national economies or in other words, they can generate relatively similar GDP per capita with a broader range of offered social services to their populations through the economy. America beats Scandinavia in the service sector’s efficiency after it maintains a predominantly commercial but not social services base. However, the Scandinavians live in a cleaner/greener environment and under significantly smaller social inequalities. This can be exemplified by the following data related to the period of 2014-2024:
a. The Scandinavian countries consistently had very high public spending relative to GDP (47–58%), while the United States averaged much lower levels (37–40%), nevertheless of their ominous ratio of total government debt/GDP of about 130%
b. These Nordic countries invest much more than the U.S. in every per cent of their GDP growth (13-17 units/per cent vs. 8.4 units/per cent, which clearly reflects the service sectors’ structural differences)
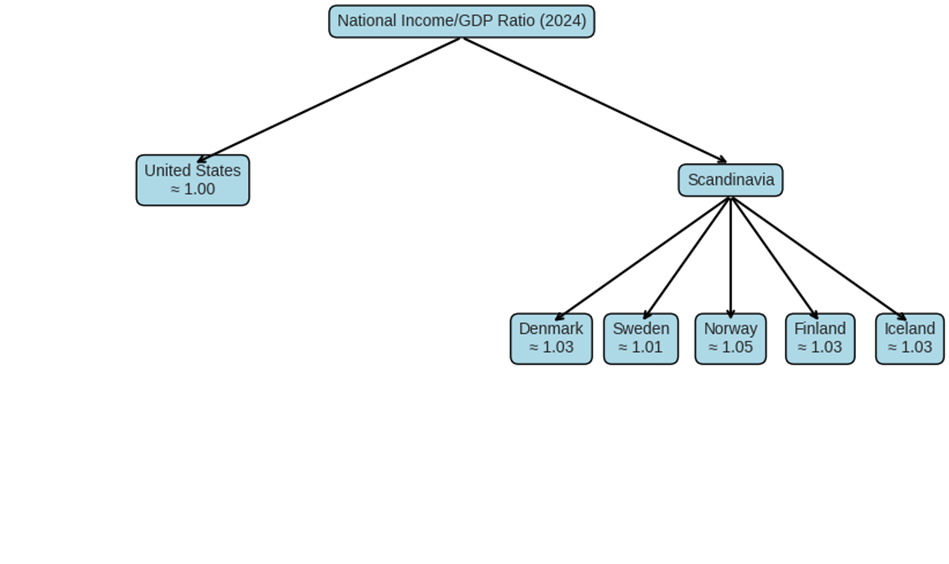
Scandinavia’s ratios are consistently higher than the US because of strong net foreign income flows, sovereign wealth funds (Norway), and pension fund investments abroad. The North European countries have 3-5 times smaller accumulated government debts to their GDPs than the U.S., too and trade surpluses instead of trade deficits.
The similarities and differences in the standards of living between the U.S. and Scandinavia do not originate only from the level of public spending and the national income redistribution, as patterns of efficiency. They have a sounder economic base – the identical labour productivities (LP) and total factor productivities (TFP) upon which the public spending levels and the income redistribution make their economic upgrade.
In 2014–2024, the average annual labour productivitygrowth in the Nordic countries was approximately:
· Denmark ≈ 1.3%
· Sweden ≈ 1.4%
· Norway ≈ 0.6%
· Finland ≈ 1.35%
· Iceland ≈ 0.9%
The US labour productivity growth for the same period was 1.4%, due to the good returns in the commercial service sectors, where the Scandinavians offer some free services (e.g., free education for everyone).
Sources: CEIC data, OECD economic surveys, and national statistical entities data
Between 2014–2024, the average annual Total Factor Productivity growth in Scandinavia was slightly above the US (0.7%), reflecting the strong local industries, good digitalisation and the energy competitive efficiency, as all that combined was materialised in a better overall capital use, offsetting the small lag in the labour productivity:
· Denmark ≈ 0.7–1.0% per year
· Sweden ≈ 0.8–1.1% per year
· Norway ≈ 0.3–0.6% per year
· Finland ≈ 0.6–0.9% per year
· Iceland ≈ 0.5–0.8% per year
Sources: CEIC data, OECD economic surveys, and national statistical entities data
In Scandinavia, most healthcare costs (75-85%) are covered by taxes, with only small patient fees.
In the U.S., healthcare is largely insurance‑based, with much higher out‑of‑pocket costs and no universal coverage. Taxes cover about 41% of the total healthcare costs.
Result: Scandinavia achievesbetter health outcomes (higher life expectancy, lower infant mortality) at lower per‑capita costs.
Keeping in mind all said above, is it now difficult for you to imagine why Mr Trump wants the Scandinavians not to ruin their beautiful countries with the green economy? To me, it is clear that the American economy, although more resourceful, is less competitive and much more indebted. The green economy will widen this margin further, while Donald should sell his Texas cronies carbon possessions, current and prospective, including in already negotiated partnerships with Putin after the Ukrainian war ends (That is why Donald needs the peace as soon as possible). Besides, in America, there are plenty of homeless and hungry people, and it is not quite so in Scandinavia. How could Donald say under these circumstances that the Scandinavians are communists and miserable leftists? The Nordics have a better quality of life, too (e.g., they work fewer hours annually, 1,500 vs. 1,800, but have labour productivity like the US one, with better overall capital use as an extra). And Scandinavians are not poorer than Americans. Obviously, Donald’s patriotic mindset cannot digest smoothly the totality of such facts. To top it off, he cannot sell to these countries expensive US LNG and cannot hurt them seriously by the carbon prices manipulation in the global markets. What indeed can then do Donald the patriot? He can do one thing, and he is doing it – he racketeers them by tariffs and tries to sweeten the racket with well-wished advice of an empathic conservative Christian. However, the racketeers, advisers or not, are normally considered criminals. Like Putin and comrade Xi, each in his own way, of course.
But whatever Donald’s weaknesses are, we should not demonise him. At least, not because the Green Deal similarly finds its vocal opposition in Europe. Mainly by right populists, often pretending to protect their national interests, as patriots like Donald. Or like swindlers, who knows? When we are talking about the patriots in the big EU countries, it is not interesting to waste time on their conspicuous corporate lobbyism and try to prove it (e.g., about Germany or Italy). It is more sensible to consider the green scepticism of smaller countries like Slovakia, Hungary and Bulgaria, as well as the EC’s lack of sufficient support for efficient green policies. These countries have built more or less cronies’ type of economies. They are among the poorest in the EU, and they cannot boast of huge renewable energy resources, either. They have export-oriented economies like the Scandinavian countries and are strongly vulnerable to the global market trends and supply chains deficiencies, including due to the modest size of their national economies. No doubt, the EC could do more for them. It could help in reducing dependence on China for batteries and raw materials by investing in European mining, refining, and gigafactories. It could also invest more in infrastructure expansion, i.e., to accelerate EU-wide charging station deployment to ensure consumer adoption of EVs keeps pace with production. It could even more support the ETS2 envisaged activities. It could further back the circular economy and recycling projects, especially battery-focused ones. It could … But how could EC do so many necessary things, indeed, if the member countries disagree to make bigger budget contributions and are against entitling it to borrow funds and collateralise its future contributions? The smaller countries like Slovakia, Hungary and Bulgaria are against even the flexibility in the subsidy resources re-distribution within the current EU subsidising programmes (e.g., in the Regional Development Programme or the Cohesion Fund cash), fearing that their farmers and state employees would lose grants they dispose of at present. The governments of these countries identically do not do anything essential to mobilise additional internal resources for green transition, e.g., they do not use paid state guarantee commitments, undertake that they can assure with private insurers or are equally against tax levies modifications (e.g., charging at least slightly more the carbon products consumers and producers). And the same governments, as well as the ones of the bigger member countries, almost unanimously are not favouring a stronger administrative centralisation under the EC power. As a whole, if we have all these factors gathered together at hand and we have them indeed, it is impossible to make the small countries adopt green economy models. Then no wonder that a Slovak opposition MEP may declare that the green economy is just an abstract and suicidal idea, when nobody in the world beyond Europe wants to apply it as per the Green Deal targets. But is it really so? I would say, no.
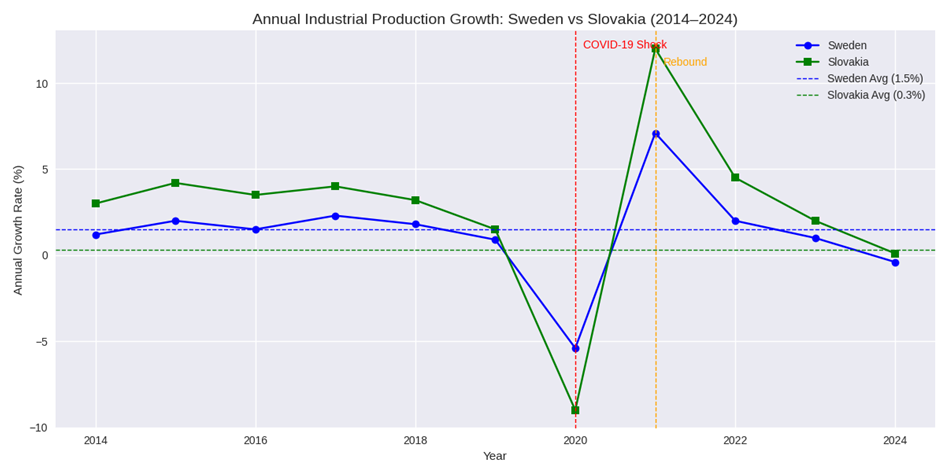
First, let us see what the shares of the green economy are in the overall economies of these countries. They are as follows: Slovakia – 4-5%, Hungary – 3-4% and Bulgaria – 3%. These shares are about 3-4 times lower than in Scandinavia. The industry shares in the national GDPs of Hungary and Bulgaria have been systematically in decline since 1990, i.e., there is no direct link between their decline and the adoption in the EU of green policies. However, there is an obvious clue between the facts that the industrial decline in both countries is at hand, but it is not used as an opportunity for faster and comprehensive introduction of green re-industrialisation. That is why I shall not analyse further their economic standing. Let us concentrate on Slovakia. It has a very high industrial share in its GDP – 32-33%, higher than even in China and Scandinavia. This share is steady over time, too. On the other hand, it relies on a modest share of energy from renewables in the total energy mix – about 15% for industrial needs and about 19% for final consumption. Those shares in Scandinavia are between 45% and 92%. Then let us compare what are the annual industrial returns in Slovakia and Sweden, as the two countries have strong automotive industries. In a longer run (2001-2025), Slovakia beats Sweden – 3.42% vs. 0.15%. But if we consider only the last decade (2014-2024), then the situation is different. During it, Slovakia registered a meagre average return – 0.1-0.7%, while Sweden reached 2% as an average during it. Does it not demonstrate the green impact on both industries as per the flexibility in its adoption? If you still doubt that everything goes mainly or clearly to the adoption of green energy and technologies for improving business efficiency, let me show you the following chart related to the national industries in the two countries:
Source: AI compilation by Copilot
What we can see from it is that Sweden managed to achieve 15 times higher production growth than Slovakia (1.5% vs. 0.3%) in the last decade, or in the decade in which green energy and technologies started being massively introduced in Europe. This result was forged out only due to the smaller annual fluctuations – you probably notice that the green curve in the chart gets higher values up and down compared with the blue curve, but the flat lines indicate how the blue one passes over the green one, because the Swedish industry proved to be less sensitive to the global market and supply chains fluctuations during the years. So, the key takeaway from this fact is that the Swedish industry became more independent and flexible than the Slovakian, besides growing as better environmentally compatible, between 2014 and 2024 due to its strong use of green energy and technologies. Therefore, is it not then more relevant to blame the Slovakian elite for the country’s industrial stagnation and its populism aimed at defending jobs by keeping low industrial competitiveness (like D. Trump) than the ideas of the green economy? Is it not equally relevant to blame the Slovakian MEPs that, instead of insisting on more flexible EU subsidies with a focus on the green transition, they want to preserve their status quo, because they can see the green ideas solely as suicidal for their business cronies? And it happens when the industry is the flagman of the Slovakian economy, which should make the conservative Christian MEPs and R. Fico’s puppets honest enough patriots in Brussels.
It is nice that the Scandinavian economies produce a bit of genuine light in a world that more and more becomes dependent on the will and whims of criminals like Putin, Trump and Xi and their transactional thinking, backed by local political swindlers in some smaller countries, who sometimes shamelessly entangle Christianity with their own moral mediocrity. At least the Nordic countries (ironically, together with China) show that the conceptual and visionary approach gains ground over the transactional one in the economy and geopolitics. It is a useful lesson, including about whether a strategy or pure money making (‘make their pockets full’ as per D. Trump) should be encouraged through economic policies and how peace deals are to be sought, as in Ukraine.