


Trump’s Isolationism Is the Ripest Fruit of the American Economic Model with Inflation Suffocating Development for Many Years

Some generations are doomed to untie hard knots in history. It seems that the current generations in America are of this kind and many ones later would depend on their choices. The choices start from the economy but reach farther and deeper to shape how the solutions today will span the whole of social life in decades.
But the US economy is simply amazing. It lags behind if analysed through the world average development indicator of the World Trade Organisation (WTO) reflecting the growth export index in merchandise trade value and volume (2015=100) for the world economy in 2024 as the global value accounts for 144.63 while the volume for 113.82 when the same numbers for the US economy are 134.48 and 111.75 respectively. On the other hand, the US economy thrives more or less. At least it is so at an aggregate level strongly influenced by the dynamic domestic service sector. The cost paid by society for its ever-growing dynamics is the declining global weight and competitiveness of the national economy. As a result, the US GDP share in the world GDP share shrinks:
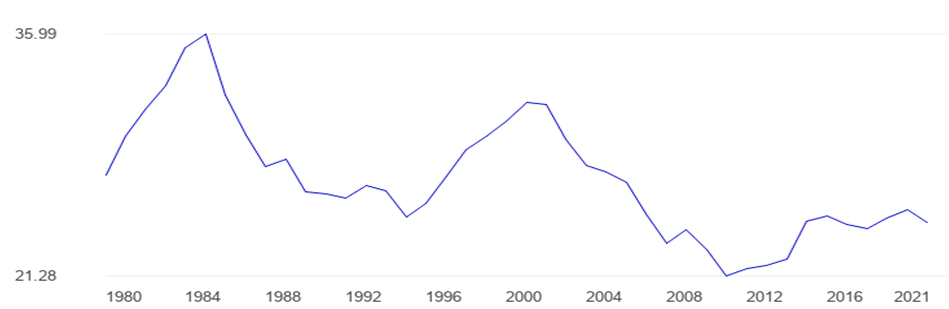
Source: https://www.theglobaleconomy.com/USA/
It raises a lot of challenges to the American economy. But to see how sustainable it may be against them, we should analyse its potential based on the domestic service sector.
Over the past, labor productivity in the US manufacturing sector has experienced a decline of approximately 5% since 2011. This decline contrasts with the overall growth in productivity seen in other sectors of the US economy.
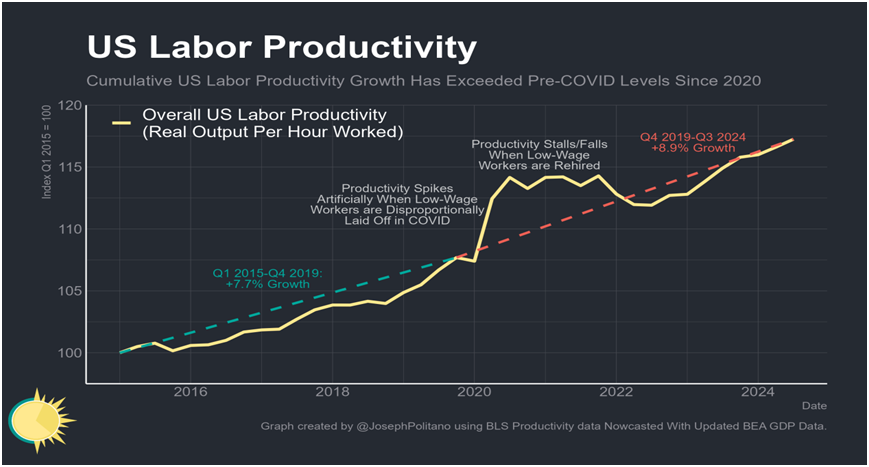
Productivity growth is nothing short of the bedrock of progress—in the long run, creating more with the same amount of labour is the only way to durably increase wages, consumption, and society’s overall prosperity. That makes it such a historic achievement that American economic output per hour worked has risen 8.9% over the last five years—faster than the five years prior or any point in the 2010s—in spite of the COVID-19 pandemic. Faster than in Europe, too. The already-great productivity recovery the U.S. had going into this year got a major upward revision from recent updates to GDP data, and preliminary estimates suggest they will get another boost as job growth will likely be revised down significantly at the start of next year.

That success is all the more remarkable compared to the dismal productivity numbers seen across many of America’s peer nations and how long it took US productivity growth to sustainably recover from the Great Recession. Since late 2019, the US has seen more than double the productivity growth of the next-fastest major comparable economy, building on an already significant lead it built up in the years before COVID. Plus, unlike the 2nd-place UK, the US has achieved this while increasing overall employment levels instead of leaving less-productive workers out of a job.

Historically, spurts of productivity growth are most concentrated in the manufacturing sector and manifest only slowly in services—in the classic example, it is hard for barbers to get faster at giving haircuts even as razor manufacturers rapidly get more productive. However, the endemic problems with American industry has meant that manufacturing productivity remains stagnant even amidst the government emphasis on industrial policy over the last four years. Thus, the nation’s recent productivity boom comes almost entirely from the service sector—cooks, programmers, drivers, nurses, bankers, teachers, cleaners, managers, caregivers, and more have all gotten significantly more efficient at their jobs over the last four years, with the gains in some subsectors being historically unprecedented in both speed and scale.
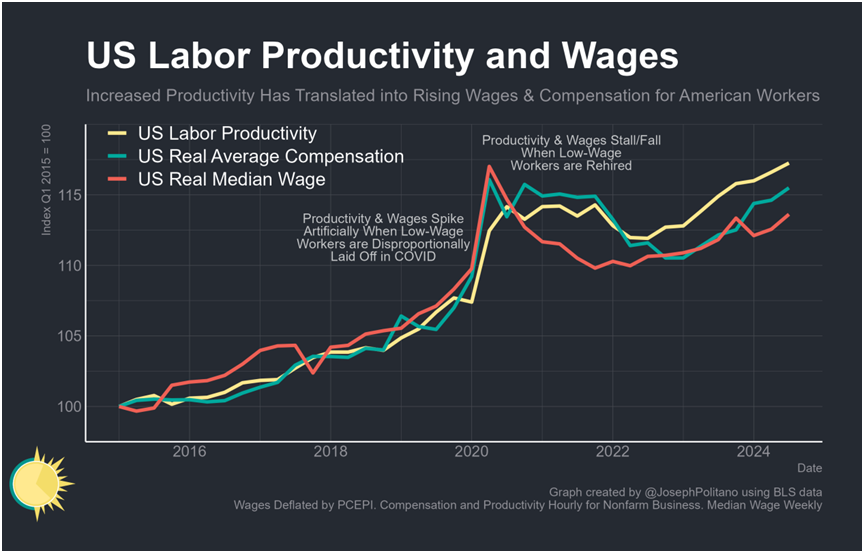
It is essential for America’s industrial policy efforts that manufacturing productivity growth returns eventually, but it is also beneficial to some degree for the country overall to have productivity improvement among the service-sector jobs that make up the vast majority of employment, consumption, and economic output according to the present economic model of America. The recent productivity boom has delivered significant gains in Americans’ real wages throughout the pay distribution (at least nominally), which in turn has enabled higher household consumption and increased personal welfare (again only nominally). From a global perspective this trend however reflects mainly an overestimating of the local labour force and further loss of competitiveness.
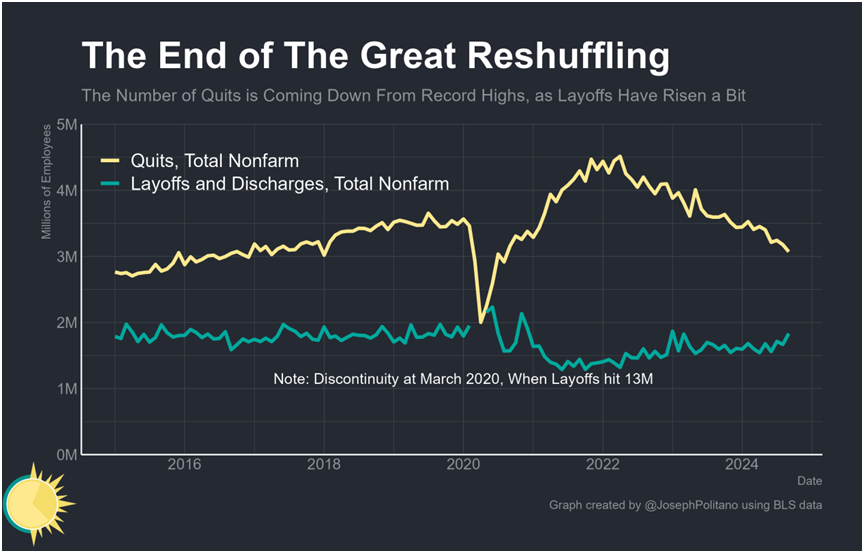
The causes of this boom are multifaceted but primarily stem from the strength of America’s labour market in 2021 and 2022, when business services sector invested significantly in productivity-enhancing capital goods (nominally), work from home became a permanent facet of white-collar life, and Americans quit low-productivity jobs for high-productivity ones at record rates. That period of intense labour demand planted seeds that have sprouted into even greater efficiency as the labour market has cooled—newly hired employees have adapted to their higher-paying roles, businesses’ capital investments have steadily come online, and the supply chain issues present throughout the early pandemic have eased significantly. In many sectors and industries, the fundamentals of work were completely restructured in a way that forced greater efficiency although the key industrial indicators were not radically changed at the national level.
But as interest rates then rose and the US economy cooled, labor demand has continued to slow to the point that America’s service-sector productivity boom is now at risk. Unemployment is up over the last year, the job churn that drove so much of early-COVID productivity gains has slowed to a crawl, hiring has fallen to recessionary levels in the high-value-added white-collar industries that represent the best of American business, and investment in some of the key fixed assets necessary for greater automation has declined. If the labour market slows further, America’s service sector productivity boom could be undermined at a key moment just as AI tools with key productivity implications are increasingly seeing mass adoption.
The Where of America’s Productivity Boom
Labour productivity is an essential measure of economic health, and at the broadest level, it is also a simple metric—just take a nation’s real economic output and divide it by the total number of hours worked by all its residents. Yet this simplicity can also present flaws for short-term analyses, as labour productivity can spike as the economy contracts if low-wage, low-productivity workers are disproportionately laid off (as was the case in early COVID), and productivity can tank when the opposite happens (as was the case in 2021-2022). Thus, although there was plenty of early evidence for an American productivity boom, it took until recently to confirm its full strength.

At the sub-industry level, productivity data is sparser and subject to even more fluctuations, so detailed 2022 and 2023 estimates were not even available until recently. That newly available data shows a notable acceleration of productivity in key white-collar sectors like professional & business services plus the information sector (which includes many rapidly growing tech companies). Meanwhile, previously stagnant sectors like accommodation & food services saw an unprecedented rush in productivity when they were forced to radically reorganize in the early pandemic, and those efficiency gains have proved durable in the years since. Finally, in other service sectors like healthcare and recreation, productivity growth was volatile but generally followed the post-2008 trend.

Perhaps the most lucid example of post-COVID productivity growth comes from the professional, business, and information sectors that have been disproportionately large contributors to overall GDP growth post-COVID. These subsectors are the largest areas of the economy that were completely reshaped by remote work—this September, roughly 1/3 of all labour performed in these industries was done at home—and that has significantly contributed to their productivity surge. Productivity growth in computing infrastructure (like Amazon web services), web search (like Google), and management all increased significantly from remote work, with areas like publishing (including software) also seeing a decent growth boost. Professional, technical, and administrative services—lawyers, accountants, scientists, management consultants, clerks, and more—also saw decent productivity gains.

Yet perhaps the more notable productivity boom comes from sectors that were previously stagnant but shocked into efficiency over the last five years. The archetypical example here is food service—it is difficult to make the process of cooking and serving food more efficient, and wage levels for cooks & waiters had long been low enough to preclude the need for greater automation. Thus, productivity gains were minimal even as the sector grew from 6.5M employees in 1990 to 12.1M employees in 2019 (It may be hilarious from a structural perspective that the cooks&waiters in the U.S. nowadays make roughly an equal number with the industrial workers).
Productivity skyrocketed in 2020—which should not be too surprising considering employment was down 2.2M and the lowest-paid workers tend to be the most likely to be laid off. Yet what is remarkable is that even as large numbers of employees were rapidly rehired, productivity only continued to improve. As the labour market tightened restaurant wages skyrocketed, increasing by more than 15% year-on-year at some points, forcing owners to invest in productivity-enhancing technologies behind and in front of the counter while sharing service between mobile ordering, delivery, and sit-down customers. Price-adjusted restaurant spending has increased by 10% since January 2020—Americans are eating out more—while employment has only increased by 1.6%—relatively fewer employees are needed to cook and plate increasing restaurant demand.
The How of America’s Productivity Boom

How did much of this service-sector productivity boom happen? The high-pressure labour market of the early post-COVID period delivered many of these productivity gains by reallocating workers to more efficient roles, firms, and industries. In the “great resignation”, monthly job quits, which mostly reflect workers swapping into new higher-paying roles, rose nearly 30% above pre-COVID levels by early 2022. It is not only that job switching radically accelerated, but the gains to switching also increased as wage growth for job-hoppers reached the highest levels on record. As workers jumped into high-productivity roles this forced low-productivity firms to adapt, raise wages, invest, or die. In the end, research from Arin Dube shows that the lowest-wage firms saw the fastest wage growth while the highest-wage firms saw the fastest employment growth.

You can see this effect even more clearly by decomposing job growth by pre-COVID industry wage level. Industries that paid the least in 2019—food services, general retailers, hotels, etc—lost the most jobs in early COVID and took years to recover to pre-pandemic levels. Meanwhile, those that paid the most—management, technical services, information, etc—saw much smaller job losses and a much stronger job recovery. The end result was a massive reallocation of employees from less productive sectors to more productive ones—even as employment rates remain at or above pre-COVID levels, the number of new jobs in high-wage industries is up 8.3% vs 3.4% in low-wage industries.
Nevertheless, if taking into view the cumulative inflation for the period 2016 – 2024 which was 22.6%, it would be obvious that there was no real wage growth in the process considered generally today as workforce restructuring. That indicates an economic vulnerability greater than economic efficiency. Psychologically, it means that the US workforce migration between jobs and sectors has come mostly from panic/fears (of some employees) but not from sectorial improved business efficiencies.

Likewise, the massive increase in job turnover also manifested as a significant increase in entrepreneurship—Americans have been starting new businesses much faster than during the 2010s, contributing to the surge in productivity growth. Post-COVID, job applications spiked dramatically and remained at a permanently higher level, with high-propensity job applications and applications with planned wages also rising significantly. The total number of self-employed employess has risen noticeably since 2019 and they continue to represent a larger share of the post-pandemic workforce. Likewise, business entry by new professionalized startups has rapidly increased post-COVID, with the annual number of newly-formed businesses with employees rising 14.3% from 2019 to 2022 and reaching the highest level since 2006. In total, the business formation boom meant people who could earn more working for themselves took their chances on self-employment, incumbent firms were pressured to innovate by a rush of hungry challengers, and investment accelerated as companies old and new sought to do more with the employees they had. However, the nominal measure of capital intensity is very different from the real one (when the inflationary re-adjustment for the period is considered) after the cumulative inflation between 2019 and 2022 was 14.7%. The latter means that the business formation growth was more or less tick-tacking in one place for the overall economy, similar to the situation with the workforce migration and the wage increase.

Indeed, America’s capital intensity—the amount of computers, machines, factories, and other assets used per hour worked—has also increased significantly post-COVID, contributing to strong productivity growth. From 2019 to 2023, the contribution of capital intensity to labour productivity growth was even stronger than throughout the four years preceding COVID. In white-collar industries like professional & business services, the recent rush of investment was particularly large and contributed to the sector’s outsized productivity gains. But these gains when comparing the chart data above with the cumulative inflation between 2015 – 2023 (i.e., 33.18%) appear not to be real gains.

In particular, real investment in key high-tech productivity-enhancing items like computers, software, and R&D all remained strong in the immediate aftermath of the pandemic. Software and computer investment surged with the 2020 work-from-home wave, while R&D output initially slowed but made a swift rebound in 2021. Today, investment in software and R&D may be slowing as the economy copes with the effects of higher interest rates, but investment in computers continues to skyrocket amidst the AI boom. However, if all that is true, then even so the US economy has not been interrupting its global share shrinking. Moreover, it allocates the highest percent of GDP for R&D among its peer countries or versus its main global competitor (China) but China despite of all, annually registers more than 6 times larger number of patents and almost three times bigger export of IT products.
Conclusions
In 2023, the services sector generated 77.6% of the US GDP, while the exports of goods amounted to about 70% of the US exports, as around 60% of all the exported goods were manufactured. The total exports reached only 11.16% of the GDP or approximately 1/7 the of the service sector contribution in it. These figures clearly demonstrate that the US economy does not possess a sufficient globally competitive potential and the modestly sized manufacturing (8.71% of the GDP) is the engine of its exports. The same conclusion is confirmed by the fact that the value added from the services sector was 4.33 times bigger than the the value added from the manufacturing sector during the period 1997 – 2021 but regardless of it, the US exports growth was dominated by the manufacturing output sales. Obviously although it is traditionally considered that the high services sector contribution to the GDP is a sign of well developed economy, a strong disproportion between it and the manufacturing sector contribution limits the global competitiveness of the national economy. The limited competitiveness, on the other hand, leads to shrinking of the national GDP share in the world GDP. The latter conceives chronic domestic inflation coming either from the growing trade deficit or the introduction of tariffs aimed at the imports restraining. Thus, the inflationary vulnerability becomes the dominant and relatively constant domestic feature of the US economy insufficient global competitiveness. The domestic inflation as we have seen from the text above beats down any achieved growth related to wages, business formation, labour productivity and gross fixed capital augmentation, i.e., the inflation cancels the achieved development in key apects of the American economy, simply because the economy is not competitive enough. The only important development indicator in it surmounting the inflationary impact is the consumption as its growth is bigger than the cumulative inflation:

Source: https://www.theglobaleconomy.com/USA/consumption/
However, inflation makes real incomes to stagnate and in this situation, the consumption growth stems almost entirely from new bank credits:

Source: https://www.theglobaleconomy.com/USA/household_credit/
It means that the structural disproportion between the services and manufacturing sectors increases the households’ indebtedness as well as consumption has no sustainable basis in the American economy nowadays. It happens in conditions of high budget deficit, low savings rate, going down demography and decreasing sum of work hours in the economy:
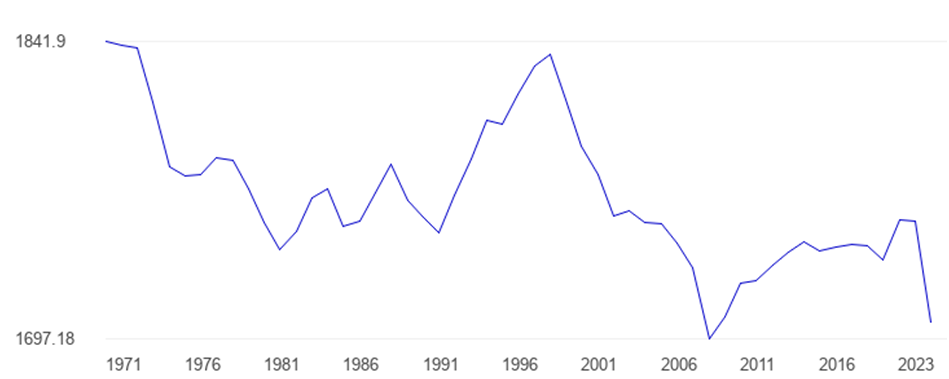
Source: https://www.theglobaleconomy.com/USA/hours_worked/
Within such a background Mr. Trump wants to reduce the American economy harms originating from its insufficient global competitiveness by isolating it behind tariffs and racketeering its trade partners with trade wars around the tariffs. Perhaps some of his buddies’ businesses would survive not being top competitive thus. And the government budget deficit may devaluate its debt burden somewhat. But Mr. Trump will also racketeer his compatriots with higher levels of domestic inflation, higher interest rates and as a result of them, by continued industrial stagnation. So the current American generations should untie the historical knot between the ‘America Great Again’ and its desperate need for re-industrialisation. Behind the knot stays the silhouette of China which manufactures 200 battleships for a year while the U.S. manufactures only 38 for 4 years, the import of numerous primary medical ingredients for the US pharma industry from China and the Chinese holding of a huge volume of American government bonds. That is said among others. Otherwise, the printing of fresh US dollars and various capital markets indexes fluctuations monitoring cannot obscure the physical reality of the American economy. Neither the mainstream US media nor politicians’ silence about its fundamental problems will change their nature.